For one thing, the cameras did not respond in a simple, linear way to changes in intensity. So, if the brightness of the surface differed by 10% in one place compared to another, the camera did not indicate a 10% difference. In addition, the response of pixels was not uniform across the detectors. These problems were corrected by carefully analyzing images taken before launch and images taken of deep space (rather than of a planet) during flight.
 |
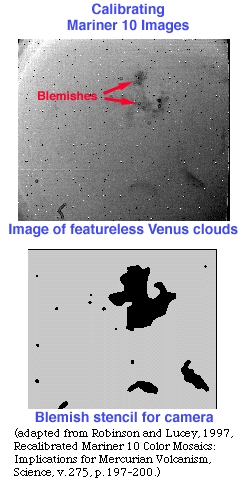
Some portions of the pixel grid did not respond at all, producing prominent blemishes on the images. This was correctable because the spacecraft flew past Venus on its way to Mercury and took images of the relatively featureless venusian atmosphere. The blemishes are clearly visible on the photos of Venus cloud tops. This allowed Robinson and Lucey to construct a stencil for each camera. The blemish-producing areas were simply ignored. Of course, this also meant that some of the surface could not be photographed. Fortunately, the spacecraft took so many pictures that any given spot on the hemisphere of Mercury that was photographed appeared outside stenciled areas in at least two images. All of these corrections were implemented using high-powered image-processing computers at the United States Geological Survey, Branch of Astrogeology, in Flagstaff, Arizona. |
Since the original analysis of the Mariner 10 data done in the mid-1970s, there have been vast improvements in our knowledge of what compositional features affect the way light is reflected off planetary surfaces. Much of this improved understanding was driven by studies of the Moon from Earth-based telescopes, combined with direct analysis of lunar samples returned by the Apollo missions to the Moon. In fact, many of the key advances were made by Bruce Haptke (University of Pittsburgh), one of the central figures in the original analysis of Mariner 10 data.
 |
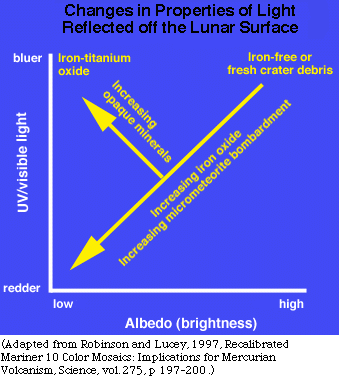
On plots of the ratio of ultraviolet (UV) to visible light (for example, orange) versus the brightness of the reflected light at one of the wavelengths we see some interesting trends. Rocks with low FeO are bright and have high ratios of UV/orange light (making them sort of blue). As FeO increases, the rocks become darker and the ratio decreases, making the reflected light redder. |
A similar effect happens as a fresh surface is reworked by micrometeorite impacts: more reworking darkens and reddens the surface (see graph). So, Lucey developed a technique for determining how far along the line on the graph a surface would fall, and called it the iron-maturity index (high maturity means a long duration of reworking by micrometeorite impacts). The first application of this technique was to determine the FeO content of the lunar surface (see Lucey et al., Science, vol. 268. p. 1150-1153).
Lunar sample analysis also shows that as the amount of dark, opaque minerals increases, the surface becomes darker. However, instead of becoming redder as it darkens, it becomes bluer (the UV/visible ratio increases). This led Robinson and Lucey to define a second parameter, the opaque mineral index. Since the mineral ilmenite (FeTiO3) is likely to be the darkening agent, this index gives a measure of the titanium content of the surface rocks.
All these trends can be indicated on a color picture by assigning colors to the parameters. Robinson and Lucey made the iron-maturity index green: the more intense the green color, the higher the FeO or the longer the duration of reworking by micrometeorite impacts. They made the intensity of red inversely proportional to the amount of opaque minerals, so the greater the red color, the lower the amount of opaque minerals. Finally, they used the ratio of UV/visible light as another variable, which helps to distinguish rock units from one another. The higher the UV/visible ratio, the bluer the image.
The resulting global image has mostly intermediate colors, of course, because the three colors combine. So, a yellow color may represent a combination of high opaque mineral abundance (red) and intermediate iron-maturity index.
Return to "Mercury Unveiled."
|
|
[ About PSRD |
Archive |
Search |
Subscribe ] [ Glossary | General Resources | Comments | Top of page ] |