|
|
|
|
|
|
|
Gamma Rays, Meteorites, Lunar Samples, and the Composition of the Moon--- Lunar meteorites provide ground truth to help calibrate orbital geochemical data, allowing an estimate of the composition of the entire Moon.
Written by G. Jeffrey Taylor |
 |
The latest of these approaches to correcting the gamma-ray data has been done by Paul Warren (University of California, Los Angeles), a renowned lunar sample specialist. He concentrated on correcting the analysis for the element thorium (Th), whose natural radioactive decay releases characteristic gamma rays. Thorium is an important element because we understand its behavior during the formation and subsequent evolution of magma, and because it is a refractory element-that is, it condenses at a high temperature from a gas. This means that if you know the thorium concentration, you also know the concentrations of all other refractory elements with similar geochemical behavior, which includes the rare earth elements, uranium, zirconium, titanium, calcium, and aluminum. Using his revised global thorium concentration as a springboard, Warren then estimated the concentration of numerous elements in the entire rocky portion of the Moon, which makes up more than 95% of the orb that graces the night sky. His estimates do not agree with those produced by others, which will lead to continued debate and refinement of the Moon's chemical composition.
References:
The Composition of the Moon and Planet Formation
Most cosmochemists subscribe to the hypothesis that the Moon formed when a huge, Mars-sized object slammed into the Earth near the end of its construction (see the computer-simulation movie of the impact, below). Understanding this event, including the origin of the impactor, is central to testing ideas about how the inner (rocky) planets formed. Determining the chemical composition of the Moon is a crucial link in our chain of evidence.
| The current consensus is that the Moon formed as the result of the impact of a Mars-sized object with the young Earth. Events like this were probably common during formation of the planets, so it is important to understand the processes operating in the hot cloud of vaporized gas and molten rock. The record of those processes is contained in the chemical composition of the Moon, so it is important to figure out what the Moon is made of. (Movie courtesy of Alfred G. W. Cameron, Harvard-Smithsonian Center for Astrophysics.) |
Earth building involved the accretion of large objects from smaller ones. Experts in the physics of planetary accretion define three major stages in the planet construction process. The first is not well defined, but involves dust grains clumping together, like those dust bunnies that accumulate under our beds (unless you are a fanatical housekeeper!). In the planet construction process the dust bunnies continued to gather more dust until there were thousands or millions of objects the size of asteroids (1 to a few hundred kilometers in diameter). Heating by the decay of short-lived isotopes such as aluminum-26 caused these planetesimals to sinter into hard rocks and even to melt. This stage lasted no more than a few million years.
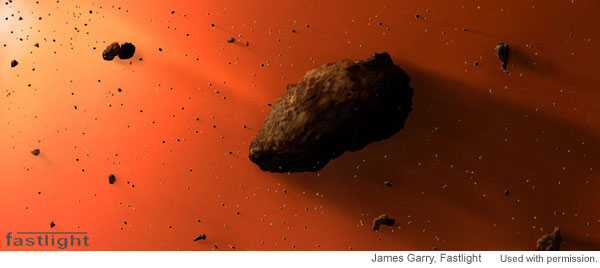 |
| This painting by James Garry illustrates the initial stage of accretion that led to the formation of asteroid-sized objects from a cloud of dust. |
The asteroid-sized planetesimals were strewn about the solar system, in circular orbits. They started to interact gravitationally, attracting each other. This led to an episode of what the experts call "runaway growth." The swarm of asteroid-sized planetesimals evolved to a group of perhaps a couple of hundred Moon to Mars-sized objects named "planetary embryos" by V.S. Safranov, a Russian theoretician and pioneer in the study of planet formation. The stage of runaway growth lasted between a hundred thousand and a million years.
Once the inner solar system was populated by planetary embryos, the planet-formation calculation wizards think that the objects interacted gravitationally with each other. Every so often two objects collided, creating a larger object. This continued until there were only a few, separated objects--the inner planets. Because the planetary embryos were so large, the impacts were extremely powerful, no doubt causing considerable melting on each growing object, and in one case forming a large object that ended up orbiting the target-Earth's Moon. Natural satellites (moons) did not usually form because that apparently required both enough mass in the two colliding bodies and an off-centered impact to give ejected debris enough sideways velocity to stay in orbit. Isotope studies of rocks from Earth, Moon, and Mars indicate that this final stage of planetary formation took no longer than about 30 million years.
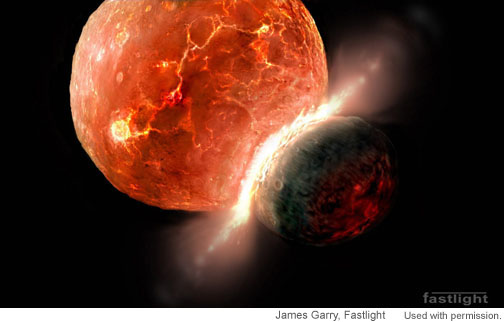 |
| Impact between planetary embryos would have been highly energetic, as depicted in this painting by James Garry. Substantial regions of both bodies would have melted, resulting in formation of metallic cores in the new, combined, larger embryo. |
There are some significant questions in the process of going from embryos to planets. The central one is the extent of mixing among planetary embryos. Computer calculations of the accreting set of planetary embryos follow the paths of each of a couple of hundred objects as the inner planets form, while keeping track of their locations at the beginning of the process. The calculations suggest that a given planet was assembled from objects throughout the inner solar system, although most come from relatively nearby. However, some compositional data hint that the feeding zone for each planet was relatively small. A good test of the extent of mixing is to determine the composition of the Moon-forming impactor (itself a planetary embryo) and compare it to that of the Earth. To do this, we must know the composition of the Moon. (We already know the composition of the Earth reasonably well from many years of geochemical study and seismology.)
 |
Calculations by John Chambers (NASA Ames Research Center) indicate that there was some mixing of planetary embryos as they attracted each other by their gravity and were scattered by the gravitational field of Jupiter. This diagram shows the results of four of Chambers' computer runs. The pie diagrams show the percentage of material in each of the final inner planets that came from the region of the solar nebula shown by the colors. Although most of the material for a given planet comes from relatively nearby, quite a bit comes from much farther away. The extent of mixing needs to be determined to understand planet formation, and the Moon's composition gives clues to the composition of the planetary embryo that hit the Earth to form the Moon. |
Understanding the Big Impact
The problem is that we do not know how the giant impact affected the material from which the Moon formed. It must have been a monumentally hot event--up to thousands of degrees Celsius. Earth and impactor (mostly the latter according to computer simulations) materials ended up orbiting the Earth as molten rock and silicate vapor. Volatile elements might have been lost, refractory elements (those that boil at a high temperature) might have preferentially condensed, and droplets of metallic iron could have been oxidized. We do not have a quantitative knowledge of the geochemical environment during the giant impact event. Understanding the composition of the Moon will help us get a handle on what cosmochemical processes operated, although we have to disentangle those effects from differences in composition between Earth and the impactor. Cosmochemistry is a tricky business.
 |
Some of the processes operating in the post-impact cloud surrounding the Earth are shown in this diagram based on ideas by Dave Stevenson (Caltech). An orbiting cloud of molten and vaporized rock surrounded the Earth. The hot, orbiting lunar birthplace might have been in chemical communication with the molten material inside the Earth, it might have lost volatile elements and preferentially condensed refractory elements, and it would have begun to accrete rapidly to form the Moon. Cosmochemists do not understand all the processes that could have operated during this violent, important event. |
Gamma Rays and Elements
The Lunar Prospector spacecraft carried a gamma-ray spectrometer. The instrument, built at Los Alamos National Laboratory, counted the number of gamma-rays as a function of their energies. The gamma rays are produced by either radioactive decay or by nuclear interactions triggered by cosmic rays with the lunar surface. This allowed cosmochemists to determine the concentrations of several elements, including potassium and thorium (radioactive decay), and iron and titanium (other nuclear processes).
 |
[Left] The Lunar Prospector spacecraft orbited the Moon in 1998. It weighed only 295 kg, small by the standards of most planetary missions. The gamma ray spectrometer sits on one of the booms. [Right] The Gamma Ray Spectrometer was a small cylinder that was mounted at the end of one of the 2.5-meter booms extending from the Lunar Prospector spacecraft. It weighed 8.6 kilograms and was 16.7 centimeters in diameter and 55 centimeters long. The gamma rays are detected by a bismuth germinate crystal that is surrounded by a plastic shield that detected and eliminated particles other than gamma rays. The instrument was build at Los Alamos National Laboroatory. |
The Lunar Prospector Gamma-Ray Spectrometer Team used its decades of experience in gamma-ray spectroscopy and nuclear physics to determine the concentrations of these elements. Many cosmochemists focused on the concentration of thorium on the lunar surface because of its importance in understanding the Moon's composition and because of its heterogeneous distribution on the Moon. However, cosmochemists who work on samples from the Moon, Mars, Earth, asteroids, and comets are accustomed to highly accurate analyses because we do them in well-equipped laboratories. The remote gamma-ray data are amazingly good considering that they were measured from a spacecraft orbiting the Moon and provide a database of the entire planet. The data did not match perfectly with what we knew from analyses of Apollo lunar samples or lunar meteorites, however. They needed to be tweaked if we were to do things like determine the composition of the lunar crust. We needed ground truth.
Ground Truth
Remote sensing observations of planetary surfaces are enhanced if we know the composition (chemical or mineralogical) in specific places. This allows us to test instrument calibrations or even to use the ground truth in the calibration procedure. In the case of thorium on the Moon, cosmochemists were concerned that the theoretical corrections were giving concentrations a bit too high in areas thought to have quite low thorium, namely in the lunar highlands on the farside. The difference was not really very large, but it adds up when determining the total amount of thorium in the crust or in the entire Moon. Besides, cosmochemists are a bit anal-retentive.
 |
This is a plot of thorium (Th) versus potassium (K) for Lunar Prospector gamma-ray data produced by Tom Prettyman and his co-workers at Los Alamos National Laboratory (red dots). Lunar meteorites are also plotted and form a well-defined line that falls to the low side of the Prettyman dataset. This suggests that the calibration is shifted to high Th values. (For the meteorite data, filled diamonds have compositions characteristic of the lunar maria (e.g., high FeO), open diamonds have compositions like those of the highlands (low FeO, high Al2O3). Similar discrepancies are found between the gamma-ray data and Apollo rock and regolith samples. The differences led Jeffrey Gillis-Davis (formerly at Washington University in St. Louis, now at the University of Hawaii) and his co-workers and Paul Warren to investigate ways to correct the data. |
One approach is to use the compositions of regolith samples (the debris pile that makes up the lunar surface) from the Apollo landing sites. We have lots of samples from these sites, so we can determine a reasonable average concentration.
 |
Apollo astronauts collected 382 kilograms of samples from the Moon. Lunar samples, besides yielding scientific treasure through analysis in terrestrial laboratories, provide excellent ground truth for calibrating observations made from orbit. Sample data were used by Jeff Gillis-Davis and his colleagues and by Paul Warren to improve the calibration of the Lunar Prospector gamma ray data. |
The down side is that the Apollo samples were collected in a relatively small area, but each gamma-ray point (or pixel) is about 60 kilometers across. Nevertheless, this is a useful approach and was the one taken by Jeffrey Gillis-Davis and his colleagues at Washington University in St. Louis. They made synergistic use of gamma-ray data and a dataset with much higher spatial resolution obtained by the Clementine mission in 1994. Clementine produced a global dataset of the amount of reflected light at several wavelengths. This allowed Paul Lucey (University of Hawaii) to develop a method for determining the amount of iron oxide (FeO) and titanium oxide (TiO2) in spots only 0.1 kilometers across.
Using Clementine data, Gillis-Davis and his co-workers examined the areas surrounding the Apollo landing sites. They found that in general the surrounding 120 kilometers were fairly uniform in FeO and TiO2 concentration, suggesting that the Th and K concentrations were also likely to be uniform. This allowed them to use the average concentrations of Th and K at the Apollo landing sites to check the measurements of K and Th reported by the Lunar Prospector gamma-ray team. They also used the compositions of feldspar-rich lunar meteorites as proxies for the composition of the farside lunar highlands. By plotting the landing site (and feldspathic meteorite) data against the Lunar Prospector data they could determine if some corrections were in order. They found that the thorium concentration reported by the Lunar Prospector team ought to be lower by a small amount and gave an equation for the correction.
 |
| On the left is the geologic map of the Apollo 14 landing site (marked by the center "+"). On the right is the same region showing FeO concentration based on Clementine data as calculated by Gillis-Davis and colleagues. Average FeO of ~12 wt% occurs in the Fra Mauro Formation (blue-purple area), whereas the mare basalts (green) have a higher average FeO of ~16 wt%. The boxes simply show where FeO and TiO2 data were collected and analyzed. The circle indicates the 2o area observed by the Lunar Prospector Gamma Ray spectrometer. |
 |
The graph above shows thorium (Th) concentration (in parts per million, ppm) at the Apollo landing sites versus Th concentration as reported by the Lunar Prospector team. Feldspar-rich lunar meteorites are also used. The line is the best fit to the data and is used to correct the Prospector gamma ray data. |
Paul Warren took a different approach. He made extensive use of lunar meteorites to establish ground truth. The tricky part of this task is that we do not know the specific location on the Moon a given meteorite comes from. What kind of ground truth is that? Warren's clever innovation was to use a plot of the reported Th concentration versus the fraction of the lunar surface with that concentration or lower, assuming that the lunar meteorites from the maria constitute no more than 17% of the surface (the percentage occupied by visible maria on the Moon), that the highland meteorites make up the remaining 83% of the surface, and that each meteorite represents the same surface are as others in its class (mare or highland). This approach works because the lunar meteorite suite approximates a random sampling of the lunar surface. Warren also used Apollo regolith samples in his calibration. The important contribution is Warren's emphasis on the parts of the surface that are low in Th. These regions make up a significant percentage of the surface, so contribute a lot of Th to our calculations of the total concentration in the crust.
 |
|
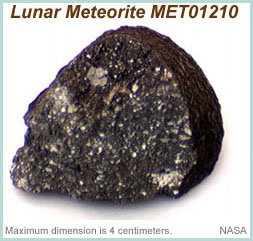
The pictures above show only two examples of lunar meteorites. Less than 1 in 1000 of all known meteorites are from the Moon. As Randy Korotev says on his excellent Lunar Meteorites web page, "You've got a better chance of winning the lottery than finding a lunar meteorite." They are that rare. All lunar meteorites have been found in deserts, for example SaU169 [LEFT, Data link from Meteoritical Database] found in Oman and MET01210 [RIGHT, Data link from Meteoritical Database] found in Meteorite Hills, Antarctica. Though extraterrestrial materials fall randomly on Earth it is simply easier to find them in deserts where they are well preserved (due to lack of weathering) and concentrated on a plain background so that they are easily recognized. Click on the photos for more information about the meteorites. | |
Warren's new calibration for Th gives very similar results to Gillis-Davis' calibration. It gives lower Th concentrations in the lunar highlands, changing the mean feldspar-rich highlands concentration from about 0.8 parts per million (ppm) to about 0.5 ppm. Because Th resides mostly in the lunar crust, this revision lowers the estimate of Th in the entire Moon.
 |
This graph shows a comparison of Warren's proposed Th recalibration (red curves) to the calibration made by the Lunar Prospector team (solid black line) and to lunar meteorites (green dots) and to Apollo regolith samples (dark dots). The sample data lies beneath the Lunar Prospector curve, indicating that the Prospector data may over estimate the Th concentration on the surface of the Moon. |
Thorium in the Crust
To determine the Th concentration in the entire Moon, we must first extrapolate the Th content at the surface to the entire crust, and then estimate the amount of Th in the mantle (which makes up most of the Moon). This is not easy! Thorium is not distributed uniformly on the surface. It is concentrated on the nearside (the side that always faces Earth), centered on the Imbrium-Procellarum region. Thorium abundance is very low in the highlands, especially in the central highlands on the Farside. The South Pole-Aitken basin on the farside is slightly elevated in Th. Th correlates in samples with lots of other elements with the same geochemical behavior (e.g., uranium, zirconium, rare earth elements), so this variation in its abundance indicates a significant chemical variation on the Moon. What caused it? Paul Warren suggests that this region is the site of an ancient, huge impact that created a basin, the Procellarum Basin, 3200 kilometers across. Although the existence of this basin is controversial among lunar geologists, geophysical measurements show that this region is the site of low topography and thin crust. In 1998, Warren and his colleague Greg Kallemeyn proposed that as the original globe-encompassing magma ocean was nearing the end of its crystallization all the elements that did not go into the main minerals (thorium, rare earth elements, etc.) concentrated in a layer near the base of the crust. If the Procellarum basin formed by a huge impact at that time, it would become a site for concentration of the leftover magma, creating the great thorium hot spot.
 |
The asymmetry in the concentration of thorium (Th) on the lunar surface is very clear in the maps, above, of the Th concentration on the nearside (left) and farside (right) of the Moon. (Diamonds on the maps show the locations of the six Apollo and three Luna landing sites.) |
 |
 |
Brad Jolliff and his colleagues at Washington University in St. Louis have defined three major terrranes on the Moon, as shown on the maps above: (1) The Feldspathic Highlands Terrane (FHT) which includes its somewhat different outer portion (FHT,O); this terrane has low FeO and Th. (2) The Procellarum KREEP Terrane (PKT), characterized by high Th. (3) South Pole Aitken Terrane (SPA Terrane), which has modest FeO and Th. These do not correspond to the traditional divisions into highlands and maria. The thicknesses of these distinctive terrains and the nature of the lowermost lunar crust are not known with certainty. |
The difficult part of determining the average amount of Th in the crust is to determine the thickness of each distinctive terrane, and whether any of them make up the lowermost crust. Lunar sample and remote sensing data have suggested to some lunar scientists that the lower crust is richer in iron oxide (FeO) and Th than the upper crust. They infer this from the presence of impact melt rocks that contain about 10 wt% FeO in ejecta from the Imbrium and Serentatis basins, as sampled by the Apollo 15 and 17 missions. Remote sensing data also suggest that deeper excavation by larger basins or thinner crust to begin with produced ejecta richer in FeO.
The surface of the lunar highlands is distinctly low in FeO, which also means that it is high in Al2O3 and the mineral feldspar. The high feldspar content is a consequence of feldspar floating in the ocean of magma that surrounded the Moon shortly after it formed. But things are much more complicated than that simple picture. The rings of most of the giant multi-ringed impact basins are composed of rocks with FeO even lower that the typical highlands surface, hence high feldspar (see map below). Cratering experts suggest that rings are deep material brought to the surface by the impact.
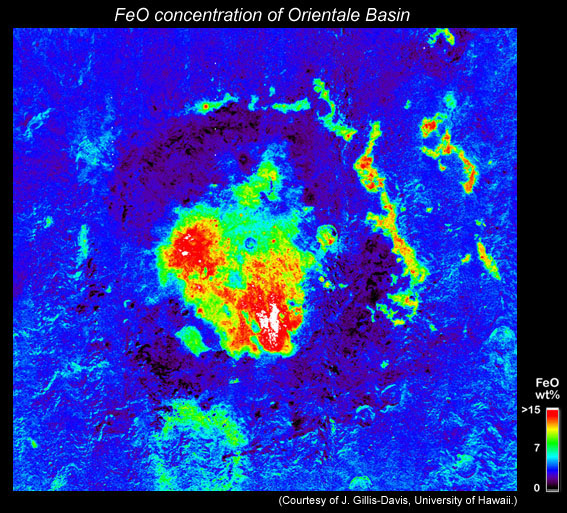 |
This map shows the FeO distribution in and around the Orientale impact basin. Note the dark ring areas (black) around the center of the basin. These areas have very low FeO, implying that they are mountains of anorthosite. The surrounding highlands (blue) are still low in FeO, but higher than the anorthosite rings. High FeO in the basin interior (red and white) are locations of mare basalt lava flows. |
Thus, the crust in the lunar highlands appears to the layered: a zone containing more FeO overlies one that is very low in FeO, which may or may not overlie one that contains a substantial amount of FeO. Most lunar scientists interpret this pile as representing the product of an original feldspar floatation crust that was intruded by magma richer in FeO (and hence contained FeO-bearing minerals such as olivine and pyroxene). Mixing by large impacts produced a mixed zone on top (the part of the crust containing 4 to 6 wt% FeO), with an anorthosite zone below that. The lower crust is a complex mixture of left over stuff from magma ocean crystallization and intruded magma.
 |
The drawing shown above depicts the complexity of the lunar crust based on a concept by Paul Spudis (Applied Physics Laboratory, Johns Hopkins University). The topmost layer of the crust is composed of a mixture of underlying anorthosite (rock containing more than 90% plagioclase feldspar) and lower crustal intrusions of Mg-suite magmas. Mg-suite magmas are slightly younger than anorthosites and may have formed when magma became trapped inside the anorthosite crust. This complicated picture is actually simplified from reality, which makes determining the bulk chemical composition of the lunar crust a difficult business. |
 |
|
The diagram on the left is a simplified version of the stratigraphy of the lunar crust, based on work by B. Ray Hawke (University of Hawaii) and his colleagues. The upper zone is a mixture of the anorthosite layer and the lower crust. The latter is rich in rocks that contain more iron-bearing minerals than does anorthosite. In terms of Th concentration, the anorthosite layer is lowest (probably less than 0.05 parts per million), the lower crust highest (between 1 and 5 parts per million), and the upper mixed zone has about 1-2 parts per million Th. | |
| |
Paul Warren also observed layering from a study of remote sensing data. In his short but information-packed 2001 paper, he showed that the Th concentration of the most deeply excavated material was lower than in the target. He did this by using Lunar Prospector data for Th and examining 50 craters larger than about 60 kilometers in diameter. Using our knowledge of impact dynamics, he reckoned that the crater floor and the rim materials lying within 1.4 crater radii of the center would come from the deepest depth. He then compared those concentrations to the Th concentration of materials farther from the crater, which he called "background concentration." This approximates the surface composition before the impact. When plotting the ratio of Th concentration within 1.4 radii of the center to the background versus crater diameter, he found a distinct correlation. As crater size increases, Th concentration inside the crater decreases, indicating that Th is lower at depth than at the surface. Warren uses this trend to estimate total crustal Th concentration, by applying what he calls a "compensation factor." He infers that this factor is about 0.6. This means that to calculate bulk crustal Th, he took the average surface Th and multiplied by 0.6. He also estimated another factor that takes into account the thickness of the crust beneath every Th concentration pixel. That correction comes out to 0.88. Combining the two factors results in a total compensation factor of 0.53. This is consistent with observations by others of crustal layering, but it does not show a lower crust rich in Th compared to the rest of the crust. That relationship is shown only by large impact basins, but not all of them.
 |
This chart shows the thorium concentration ratio (inside crater and nearby ejecta divided by Th in the surrounding area) vs crater diameter. The larger the crater, the lower the ratio. This means that Th decreases in depth in the lunar crust, at least in the upper 30 kilometers or so. Warren uses different symbols for different initial Th concentrations. They intermingle on the plot, showing that the initial surface concentration does not correlate with concentration at depth. |
Warren estimates an average surface concentration of 1.35 ppm. Multiplying by the correction factor with depth, he finds that the Th concentration in the entire crust is about 0.7 ppm. Other estimates are higher. For example, Brad Jolliff and colleagues at Washington University in St. Louis estimate a crustal Th concentration of 1.05 ppm. In a paper submitted for publication, my colleagues and fellow Taylors, S. Ross Taylor (Australian National University) and Lawrence A. Taylor (Univ. of Tennessee) and I estimate a crustal Th concentration of 0.75 to 0.9 ppm. Overall, that is remarkable agreement, with the total range being only from 0.7 to 1.05 ppm. The variation in the estimates is caused by different approaches to handling how Th varies with depth in the lunar crust.
Whether 0.7 or 1 ppm, there is a lot of Th in the crust compared to the mantle, which we'll look at next. How much the crustal Th contributes to the total Moon inventory depends the thickness, hence the volume, of the crust. We used to think that the crust was much thicker than we do now. In the mid-1970s the crust was thought to be between 60 and 70 km thick. However, the best estimates of the thickness of the crust are from recent reworking of the old Apollo seismic data and new ways of analyzing the combination of lunar gravity and topography. These results suggest that the crust is only about 45 to 52 kilometers thick on average, though it might be as thin as 30 kilometers in the Procellarum KREEP Terrane. Paul Warren uses a value of 48 kilometers. All this combines to give a crust contribution to the bulk Th in the Moon of about 0.05 ppm in Warren's assessment. Other recent estimates place the value somewhat higher, around 0.07 on average, assuming a crust only 45 km thick.
Thorium in the Mantle
Precisely figuring out the average Th concentration in the lunar crust seems to be nearly impossible--but it is easy compared to figuring out the Th concentration in the mantle. One way is to use the Th concentration in lunar basalts to infer the composition of the regions of the mantle in which they formed. Brad Jolliff and his colleagues did that, concluding that the mantle contains about 0.04 ppm. I did the same thing in a couple of papers and concluded that the mantle source regions for mare basalt magmas contained between 0.03 and 0.1 ppm. Not much, but if the crust has only 0.7 ppm (which contributes 0.05 ppm to the bulk Moon Th), then the ratio of Th in the crust to Th in the mantle is between 7 (for 0.1 ppm Th in the mantle) 23 (for 0.03 ppm in the mantle). As Warren points out, that seems too small a concentration considering the extensive differentiation that must have accompanied crystallization of the magma ocean. If the crust contains 1 ppm of Th, then the crust/mantle ratio is between 10 and 33, still small. This suggests either that the magma ocean products were mixed extensively back into the mantle, or that there is less Th in the mantle than many of us have inferred. Warren favors the latter idea. He presents data from terrestrial basalts and the likely mantle source regions in which they formed to suggest that the crust/mantle ratio should be 50 or more. He concludes that the lunar mantle contains no more than 0.025 ppm Th.
Putting the Th concentrations in the crust and mantle together with the weight percentages of the crust and mantle (7%and 93%, respectively) in the silicate portion of the Moon, Warren recommends a bulk Th concentration of 0.073 ppm, indistinguishable from estimates of the Th concentration in the bulk silicate Earth (crust plus mantle), 0.075 ppm (plus or minus 0.06 ppm). Brad Jolliff came up with 0.14 ppm in the Moon, double that of the Earth. The traditional view, argued in a series of papers over the past three decades by Ross Taylor has been that the Moon is enriched compared to the Earth by about 50%, in between the Warren and Jolliff estimates. The exact value is very important as it may hold the evidence for processes that operated after the giant impact that formed the Moon. If no enrichment in Th (hence in all the other refractory elements), then perhaps the Moon's raw materials did not form simply by condensation from a hot cloud of silicate vapor. If there is an enrichment in refractory elements compared to Earth, then perhaps such a hot origin is implicated.
One way to test whether Th is enriched in the Moon compared to Earth is to determine the concentration of another refractory, but one whose geochemical behavior is different. Aluminum is particularly useful because the lunar crust has lots of it. The problem is that we do not have a clear idea of how much aluminum there is in the mantle of the Moon. Estimates range from 2.5 to 7 wt% Al2O3, compared to 4.1 wt% in Earth. (Major--the most abundant--elements are traditionally listed as oxides, rather than elements, as they are always bound to oxygen in mineral structures.) Warren estimates Al from the Al/Th ratio in chondritic meteorites, a perfectly reasonable thing to do because the refractory elements occur in the same relative abundances in all types of chondritic meteorites. His estimate is 3.8 wt%, basically the same as the bulk Earth, but that is not surprising because it is derived from his estimate for thorium, which he estimates is same as in the bulk Earth. We can try to estimate Al independently by determining Al2O3 in the crust and mantle. We have the crust under control. It almost certainly contains between 24 and 29 wt% Al2O3. In contrast, we are relatively clueless about the mantle. My Taylor colleagues and I guess it is between 3 and 4 wt%, but we need more data to pin that down.
Other Elements
Once you know Th you know a slew of other refractory elements. Volatile elements are also not too difficult to determine. For example, we can use the ratio of potassium to thorium (K/Th) or K to any other refractory element. This gives a global value for K/Th because during melting and crystallization in magma these two elements behave similarly, so their ratio stays relatively constant. Data from lunar samples and Lunar Prospector show that the Moon is clearly depleted in moderately volatile elements such as potassium. The K/Th ratio is about 360 compared to 2900 in Earth and 5300 in Mars. The Moon is clearly depleted in volatiles. Highly volatile compounds such as H2O are present at extremely low levels. In fact, there is essentially no water inside the Moon. Amazingly, all lunar scientists agree that the Moon is depleted in volatile elements compared to chondrites, Earth, and Mars.
One of the very important elements that Warren tries to pin down is magnesium (Mg). We usually go after this by examining the variation in a somewhat complicated ratio: Mg/(Mg+Fe). Those of us who study how magma changes in composition as it crystallizes are particularly fond of this ratio because it tends to systematically decrease with crystallization. This happens because the first minerals to crystallize tend to take up more Mg than they do Fe, leading to a decrease in the ratio. It is also useful because it varies from 0 to 1. Or from 0 to 100 if multiplied by 100 as is often done to give the ratio in mole percent. It is abbreviated in several ways: mg, mg', mg, Mg#, and mg#.
The standard Moon composition model has an mg# of 79. In contrast, the bulk silicate Earth (crust+mantle) has an mg# of 89. Clearly a big difference. However, Warren argues strongly that the lunar mg# is much higher than our standard model. He says that lunar scientists have been biasing the estimates by putting too much weight on the origin of mare basalts, which are exceptionally rich in FeO and have low mg#. In fact, he is a tad irritated by this suspected bias, as seen from this sentence in his paper: "The notion that mare basalts can supply more than marginal constraints on bulk lunar mantle mg# is likewise a facile approach based on a doubtful premise." There is no doubt that mare basalts provide only one look at the mantle, and maybe not a very thorough a look at that. They make up only about 1% of the crust, so maybe they are telling us about only a few percent of the mantle.
There are lunar igneous rocks with much higher mg# than mare basalts. In fact, the typical highlands (based on both Apollo samples, lunar meteorites, and Lunar Prospector data) range in mg# from about 55 up to 94. The low values are from areas dominated by anorthosites, the product of magma ocean crystallization. There are quite a few samples in the upper part of that range (88 to 92). These would have formed by partial melting of a region of the mantle that has an even higher mg#. In short, there must be high mg# mantle areas (to form the highland samples) and low mg# areas (to form the mare basalts). The question is how much of each.
Another way of looking at the problem is to try to determine the concentration of FeO in the lunar mantle. The places where mare basalts formed in the mantle clearly had high FeO (around 18 wt%), as Warren points out, but we cannot use just the mare basalt data. The highlands rocks with high mg# have much lower FeO, so their mantle birthplaces must also have low FeO. I estimate around 7 wt%. The bulk Moon FeO estimated from the lunar density and moment of inertia (which measures the density distribution inside the Moon) indicate a bulk FeO content of 13 wt%, in between the mare and highland rock mantle birthplaces.
Paul Warren favors a high mg# for the Moon--in fact, a mg# indistinguishable from that of Earth. Others (including me) favor a somewhat lower value for the Moon (maybe around 80), but the real truth is that there are enormous uncertainties in any of our estimates. What we do know is:
More Information, Please
It is not easy to figure out the composition of an entire planetary body. The fact that we know as much as we do about the bulk composition of the Earth is a triumph of cosmochemistry. On Earth we have samples of the mantle brought up by erupting magmas and thrust up onto one large tectonic plate by the subduction of another. We have seismometers all over the world that help us understand the properties, hence the mineralogy, of the interior of the Earth.
The Moon is a different story. We have no mantle samples, though we might be able to collect some if we were to sample the right places. One such place is the South Pole-Aitken basin, an impact crater 2500 kilometers across. It should have dug down into the mantle, delivering chunks of mantle rocks to the surface, or at least incorporating melted mantle rock into impact melt breccias that make up its floor. A sample return mission from South Pole-Aitken would bring back a priceless treasure about the Moon's chemical composition.
 |
|
This map shows the topography of the South Pole-Aitken basin on the Moon. The black dashed lines outline the basin and locations of its mountainous rings. The total elevation difference from the center (purple tones) to the highest areas outside it (white tones) is about 12 kilometers. The basin should have excavated into the lunar mantle. | |
| |
Installation of a global seismic array on the Moon would lead to major advances in our understanding of the structure of the crust and compositional variations inside the mantle. The velocities of seismic waves can be used to determine the mineralogy and mineral compositions at depth in the Moon. In particular, geophysicists will be able to greatly decrease the uncertainty in our estimates of the mg# and Al2O3 concentration in the interior of the Moon.
The Moon's origin by a giant impact is a dramatic event that does not necessarily follow conventional cosmochemical processes. Understanding it is important if we are to understand planet formation. That understanding will not come until we know the bulk chemical composition of the Moon as well as we know the composition of Earth.
![]() LINKS OPEN IN A NEW WINDOW.
LINKS OPEN IN A NEW WINDOW.
|
|
[ About PSRD |
Archive |
Search |
Subscribe ] [ Glossary | General Resources | Comments | Top of page ] |